Stop guessing.
Start tracking.
Deep analytics for every QR code you create. See who scans, where they are, and what they use — all in one dashboard.
No credit card required
Features
Everything you need to measure what matters
From the first scan to the final report, LitQR gives you the data to turn every QR code into a decision.
Dynamic QR codes
Change the destination URL anytime without reprinting. Your QR code stays the same; where it goes is always up to you.
QR management
Organize, tag, and search every code in one workspace. Bulk edit, archive, and keep campaigns tidy.
Total & unique scans
See total scans and deduplicated unique visitors separately. Know real reach, not just clicks.
Daily scan chart
Track scan velocity day by day. Spot spikes, measure campaigns, and catch momentum early.
Geo breakdown
See scans by country and city. Understand where your audience actually is — and where to invest next.
Device & browser
Mobile vs desktop, Chrome vs Safari. Optimize landing pages for the devices your scanners actually use.
Analytics
A dashboard that actually tells you something
Most QR generators give you a counter. LitQR gives you a cockpit. Here's the real thing — not a mockup.
Overview
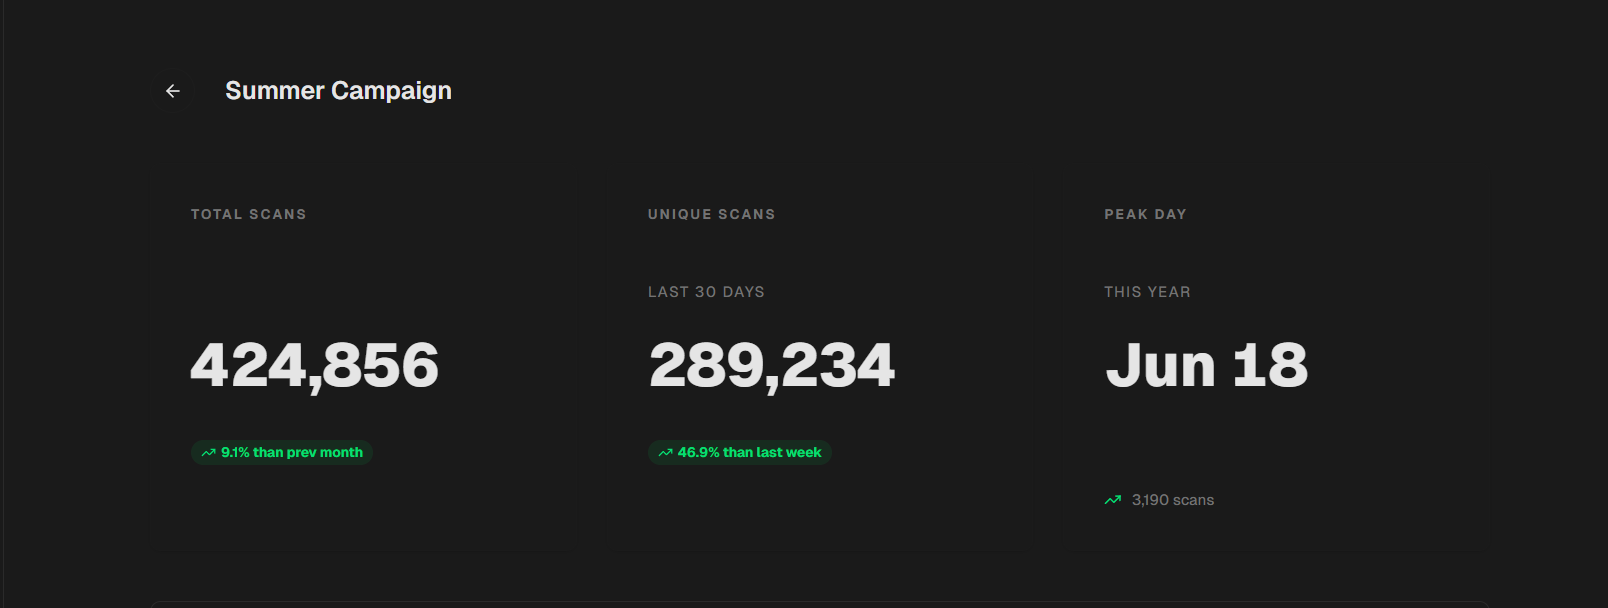
The numbers that matter, front and center
Total scans, unique visitors, and peak performance in one glance. No digging, no spreadsheets.
- 424,856 total scans at a glance
- 289,234 unique visitors deduplicated
- Peak day tracking to spot your best moments
Trends
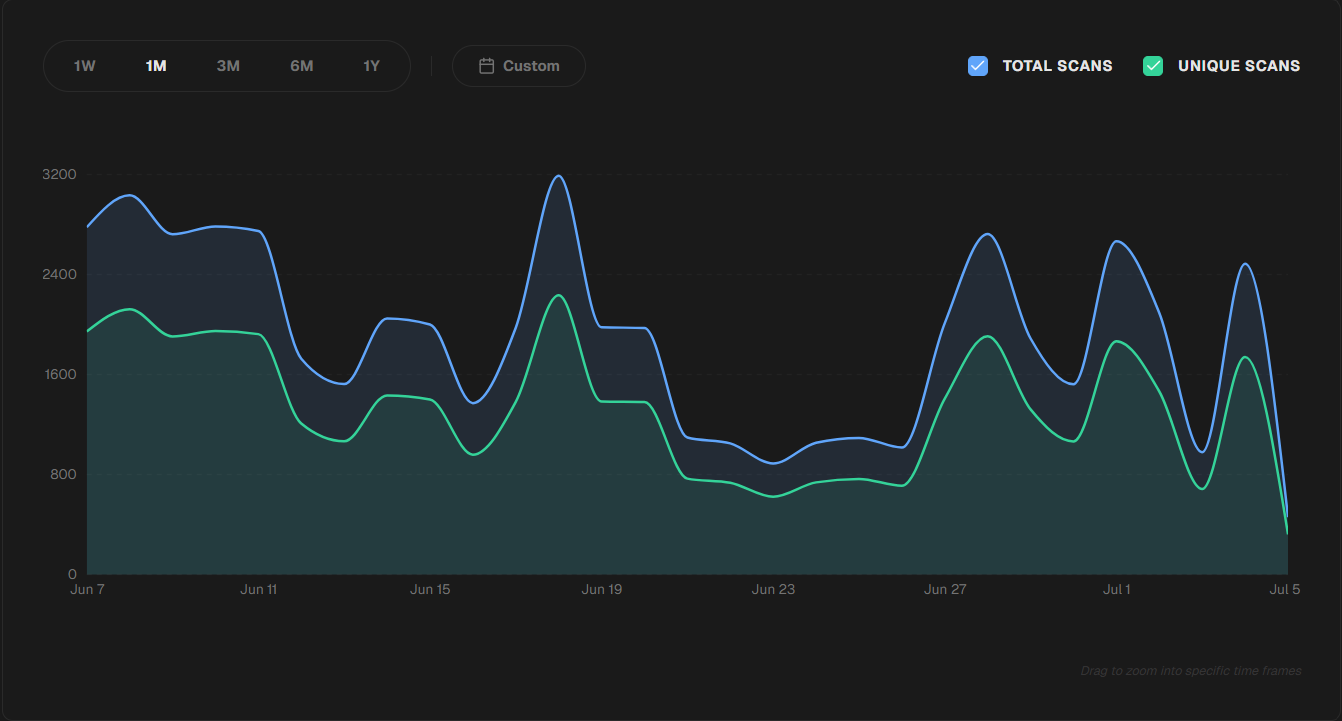
Watch momentum build day by day
An area chart that separates total from unique scans, so you can tell real growth from repeat traffic.
- Total vs. unique scans on one chart
- Date range picker for any window
- Spot campaign spikes the moment they happen
Dimensions
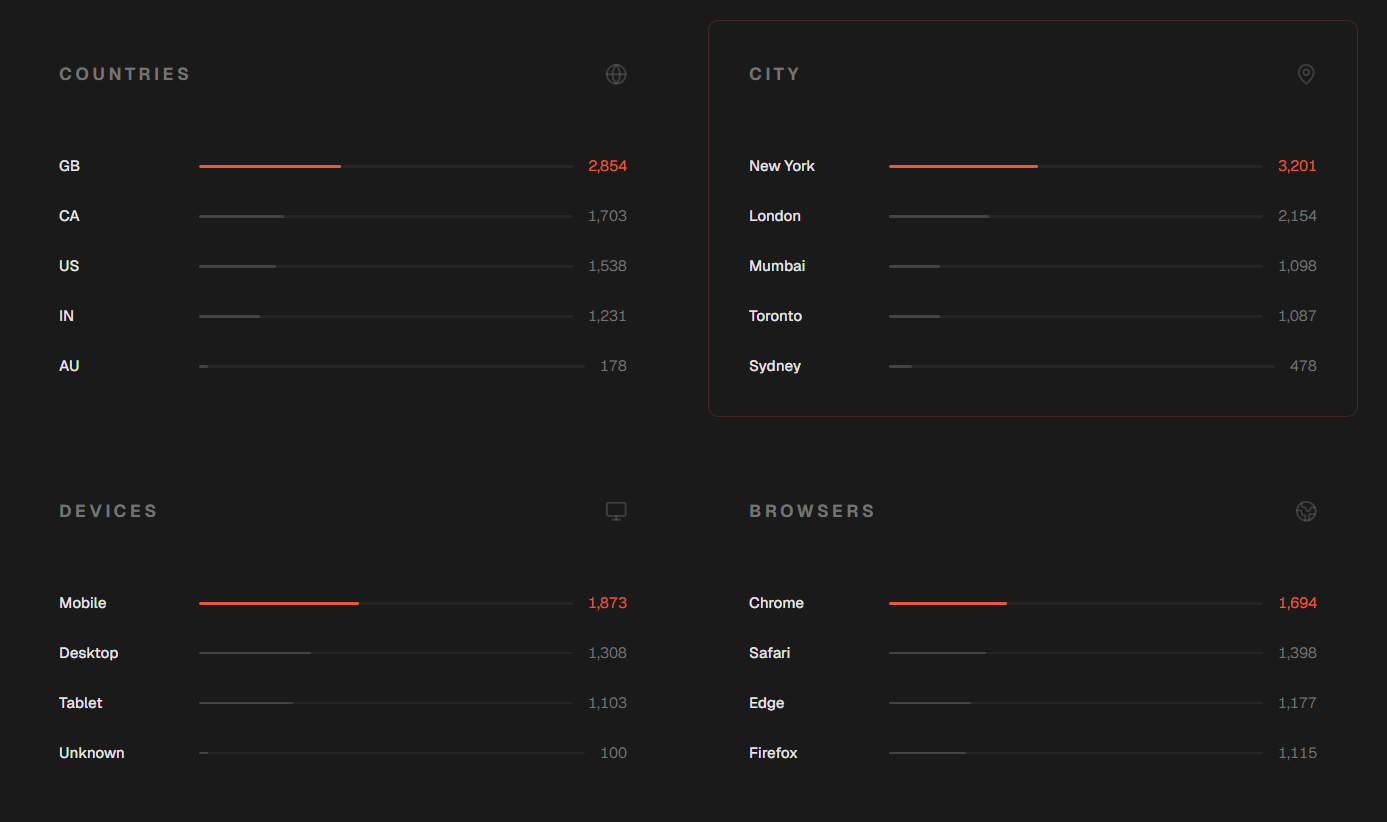
Know who scans, where, and on what
Country, city, device, and browser — every dimension that helps you optimize the landing page on the other side.
- Country and city-level geo breakdown
- Mobile vs. desktop vs. tablet split
- Browser distribution to tune compatibility
Pricing
Start free. Upgrade when it pays for itself.
Seven days of full access, no card. If LitQR earns its place, Pro is one click away.
Free Trial
Full access, no credit card. See if LitQR fits before you commit.
No credit card required
What you get
- 7-day full access trial
- No credit card required
- Up to 25 dynamic QR codes
- Total & unique scan tracking
- Daily scan chart
- Geo + device breakdown
Pro
For teams running real campaigns at scale. Higher limits, priority support.
What's included
- Everything in Free Trial
- Up to 1,000 dynamic QR codes
- Unlimited scan history
- City-level geo breakdown
- CSV & PDF report exports
- Priority email support
Your next QR code shouldn't be a black box
Create your first dynamic QR code in under a minute. See scans roll in immediately. No credit card, no commitment.
No credit card required